You can use a site speed test to measure the performance of your website. Google has developed their own tool called Page Speed Insights. It analyses your website and gives you recommendations on how to improve your website’s loading times.
So what is Google Page Speed Insights and what are the advantages?
The Google Page Speed Insights tool is a free web application provided by Google which will help you to optimise your website’s loading speed.
It measures the performance of any given webpage and provides suggestions on how to improve it. The test results are based on following criteria: First Contentful Paint (FCP) – time at which main content of page appears; DOMContentLoaded (DCL) – time when document has been parsed; Load (time), aka “Time to Interactive” – moment when browser can handle user input such as mouse clicks or taps; Perceptual Speed Index, an estimate for human perception of load times in seconds; TTI Success Rate, %age of successful loads where Time-to-Interactive.
You can use any site speed test to measure the performance of your website. But Googles tool will analyse and give you recommendations on how to improve your website’s load time. In this article we’ll take a look at what the tool is about, and provide some quick tips on how to get started with it! There are a few things to note before you get started with Page Speed Insights.
Why is it important to check Google PageSpeed?
Google recommends a fast website as it is taken into consideration for their Mobile friendly rankings and algorithm. They consider this essential for your SEO strategy.
The other cost is for UX reasons, the time it takes your users to load web pages. Users may be on a slow connection and want quick access to information. You should aim for as fast loading speed possible.
How does it work?
Google Page Speed Insights will give you suggestions to improve your site’s page speeds such as:
– Minifying code (reducing file size)
– Leveraging browser caching
– Optimising images (compressing them down without sacrificing quality)
– Use Google Analytics data from real user monitoring tools like New Relic and Calibre
– Serve scaled images instead of resized ones when necessary
The Page Speed Insights tool is only available for websites that are publicly accessible, so you need to make sure that your pages are not password protected or within a closed area. There is an alternative which is part of the Google Chrome browsers “Developer Tools” called “Lighthouse” and can be run from any webpage.
This can be a password protected page in a closed area or even a page you are running locally which no-one else can access. It does however rely on your local computer resources and can differer considerably if you have lots of windows open so is best to run in an “Incognito” window on its own for a more accurate test.
- Getting a base score
First we ran it through PageSpeed Insights to get a base score rating to see what we were up against.
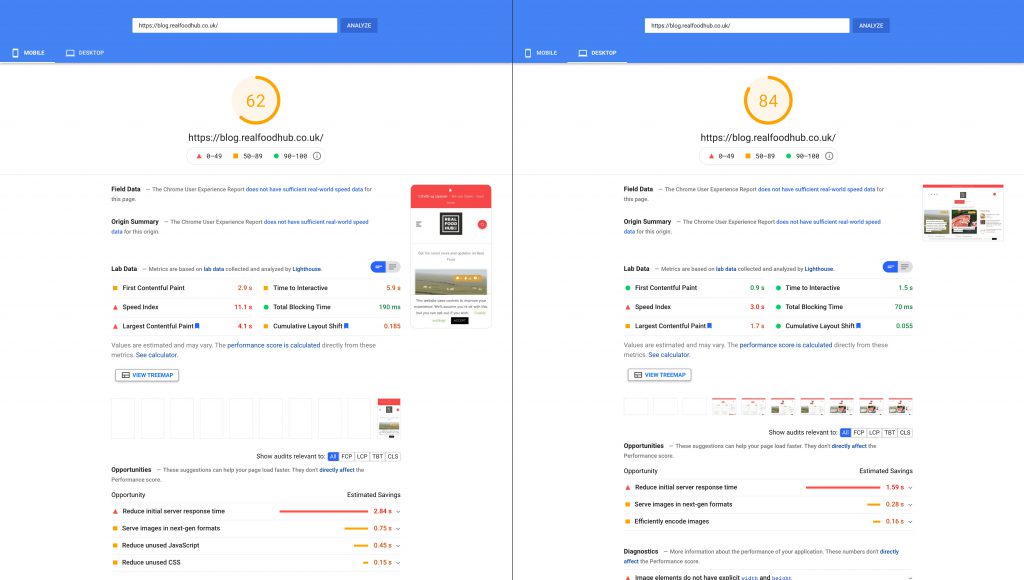
Desktop 84 and Mobile 62
We started with quite a good score, this was due to to us already implementing a few things as part of our usual process, such as minifying stylesheets & javascript, enabling text compression, server caching and long life caching on static assets, such as images, and script files.
On the summary screen the Key things to look at are the Main score rating at the top. The “Lab Data” gives you a good overview of where your issues lie. Probably the most important area to take notice of are the “Opportunities” list. The “Opportunities” list are the elements we need to improve upon to improve our score.
A very useful tool is the “Calculator”, click the “See calculator” link and it allows you to adjust the sliders regarding each task. You can then see which adjustments affect the total score the most. This can be useful if you are limited on time but wish to concentrate on the key elements to get the biggest score gain.
The images have been flagged as an issue. The first task for us was to optimise the images by reducing the file size and remove any unnecessary metadata.
At the same time we looked into reducing the unused Javascript and unused CSS. We also pulled in the CSS to load inline and deferred any unnecessary Javascript on initial load. This would improve the initial response times, as external scripts take longer to initiate
We then ran the test again and we got the following results.
2. Second Run
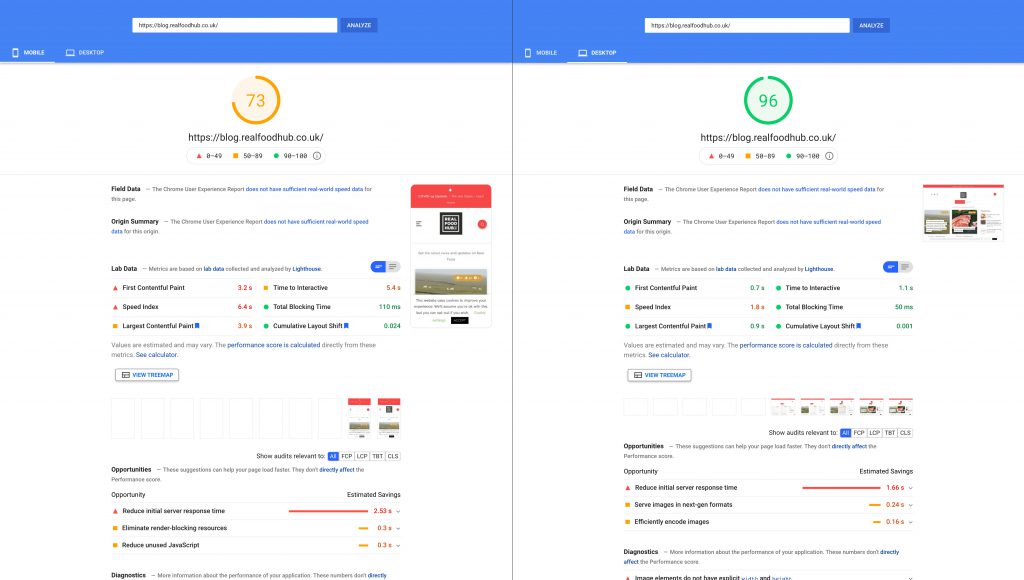
Desktop 96 and Mobile 73
Quite a considerable jump and the lovely score in “Green” gives you that satisfaction that you’ve achieved a goal.
We still had a few “Opportunities” to improve upon so we kept working through the list.
Our images had improved greatly from the reduced size but “PageSpeed Insights” still recommended that we convert them to a next gen format such as “WebP and AVIF“.
AVIF is the new kid on the block which is based on the AV1 video codec. It can fit high quality images in an even smaller file sizes than WebP. It’s still quite new, so browser support can be an issue. Processing speeds seem to be slower than WebP. We think that over time as browser development moves forward, speeds will improve. So for now we made the decision to stick with WebP. We created a WebP conversion of all image assets, but also kept the original image files as a fall back. To ensure incompatible browsers would then default to the original image format.
We ran the test again with the following results.
3. Final Results
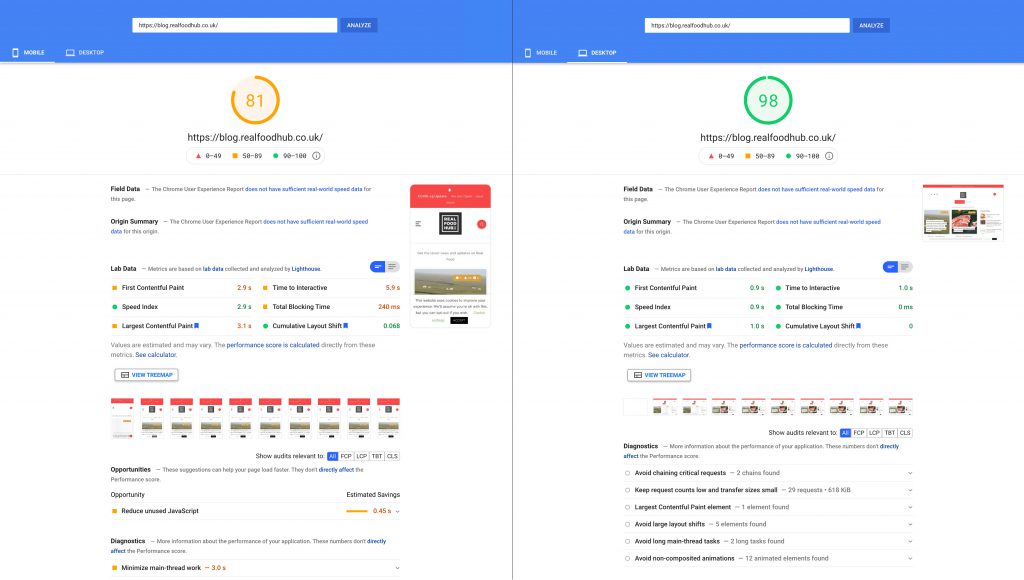
Desktop 98 and Mobile 81
We were pleased with the result, it’s not a perfect score but you have to realise that in reality its very difficult to get a perfect score. When you have page with a considerable amount of content with images and other scripts running through it.
It’s easy to have a perfect score on pages with small amounts of copy and minimal style as theres nothing to load. In the real world, pages with a reasonable amount of content on the page with images will struggle to get a perfect score. Consideration must also be taken in balancing the User Experience along with optimising the score as some of the Page Insight recommendations can put a negative effect on your UX.
Our takeaways are that 98 is a brilliant score for the Desktop view and 81 is very good for the Mobile view. The main point is that the Largest Contentful Paint loads in 3 seconds on mobile.
If you require assistance with your website speed, please Contact Us.